 Esperanza FireAccident Review Board Action PlanCDF Green SheetAccident Investigation
|
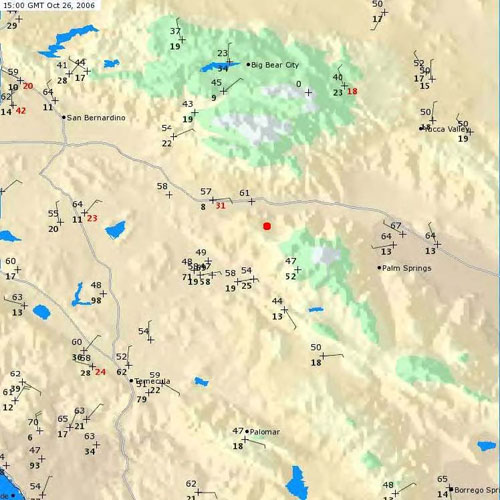
Appendix 6 – Fire Weather Analysis SummaryOn Wednesday, October 25, 2006, a winter storm moved from Idaho through Utah into Colorado. Behind this winter storm high pressure was building southward into Nevada. The combination of high pressure building into Nevada from the north and low pressure off the California coast caused a moderate Santa Ana Wind event over Southern California from late Wednesday evening though late Saturday evening — October 25 through 28, 2006. This weather pattern is a classic setup for a Santa Ana wind episode. The National Weather Service Forecast Office (NWSFO) in San Diego (which has forecast responsibility for the area surrounding the Esperanza Fire) first mentioned the possibility of Santa Ana Wind conditions on Saturday, October 21 at 1:45 p.m. Pacific Daylight Time (PDT) in an issuance of the Fire Weather Planning Forecast. On Tuesday, October 24 at 2:15 p.m., NWSFO San Diego issued a Fire Weather Watch for the area which included the San Jacinto Mountains. On the morning of Wednesday, October 25, 2006, during the daily conference call between NWSFO San Diego, NWSFO Oxnard, and the South Area Operations Center Geographical Area Coordination Center (South Ops GACC), there was unanimous agreement that a Red Flag Warning was warranted for the area beginning Wednesday night. NWSFO San Diego issued a Red Flag Warning for the area the morning of Wednesday, October 25 at 10:34 a.m. PDT. It is NWSFO San Diego policy to fax all Red Flag warnings to the dispatch centers affected by the warning. This Red Flag Warning was faxed to the CAL FIRE Riverside Unit (RRU) Dispatch Center at 10:51 a.m. and to the San Bernardino National Forecast Dispatch center at 10:59 a.m. At 4 p.m. PDT on Wednesday, October 25, the San Bernardino National Forest dispatch center broadcast the Red Flag Warning information on their radio network. All forecasts of this Santa Ana Wind episode issued by NWSFO San Diego were consistent from the Tuesday issuance of the Fire Weather Watch to the Wednesday afternoon issuance of the Fire Weather Planning Forecast. These forecasts called for Santa Ana Wind conditions to begin late Wednesday night (October 25, 2006) with the strongest winds expected Thursday morning after sunrise. Peak wind speeds were forecast to reach 40 miles per hour (mph) with gusts to 60 mph possible in mountain passes. Relative humidity was also forecast to fall to be at or below 10 percent during the entire time the Santa Ana wind was blowing. At roughly 2:30 a.m. on Thursday, October 26, 2006, the forecaster at NWSFO San Diego noticed a hot spot (indicating a possible fire) near San Gorgonio Pass on infra-red satellite imagery. At 3:13 a.m. PDT on Thursday, October 26, the RRU dispatch center received a request for a spot weather forecast for the Esperanza Fire from commanders in the field. This spot request was entered into the NWS computer system at 3:16 a.m. PDT. According to NWS computer records, an identical spot request was entered at 3:33 a.m. PDT. The request as entered into the computer system contained a latitude/longitude that was approximately 70 miles southwest of the Esperanza Fire. The NWS forecaster in San Diego, who was responsible for generating the spot forecast, recognized a disconnect between the latitude/longitude (San Diego County), the dispatch center (RRU) call back number, and the hot spot noticed about an hour earlier. The forecaster generated a forecast for the San Gorgonio Pass area based on the hot spot and the RRU call back number, ignoring the latitude/longitude coordinates on the spot request which were in San Diego County. The forecast was completed at 4:00 a.m. PDT. Upon completion of the forecast, the forecaster called the emergency call back number on the spot request to discuss the discrepancy in latitude/longitude, but there was no answer at the call back number. The NWS faxed the spot forecast to RRU at 4:10 a.m. PDT. The CAL FIRE Riverside Unit Dispatch Center (RRU) distributed the spot forecast on their email system at 5:25 a.m. PDT to local, state and federal fire dispatch offices within the Southern California Geographical Area (which includes Riverside, San Bernardino, and San Diego). The information in the spot forecast generated by NWSFO San Diego was unchanged from the Fire Weather Planning Forecast and from the Red Flag Warning both of which were last sent around 2:00 pm PDT on Wednesday afternoon. The Santa Ana Winds were observed by the Beaumont Remote Automatic Weather Station (RAWS) that is located in Beaumont, California just west of the San Gorgonio Pass as shown in Fire Weather Table 1. This observation data covers the period from Wednesday afternoon October 25 through Thursday afternoon October 26, 2006. On the evening of October 25, prior to the onset of the Santa Ana Winds, humidity values were in the 30 percent to 75 percent range, winds were out of the southwest, and pressure was fairly steady. Beginning at 9:10 p.m. on Wednesday, October 25, winds switched to an easterly direction, pressure began a slow rise, and humidity values dropped rapidly. The wind speed at Beaumont steadily increased from 6 mph to gusting 16 mph at 10:10 p.m. PDT Wednesday to 19 mph to gusting 39 mph at 10:10 am PDT Thursday. Humidity values also saw a sharp drop from 75 percent at 9:00 p.m. on Wednesday, to 7 percent shortly after midnight early Thursday morning. Humidity values at the Beaumont RAWS remained below 20 percent with winds ranging from 15 to 40 mph through 7:00 p.m. on Saturday, October 28, 2006. It should be noted that twice on October 26, the Beaumont RAWS reported wind gusts of exactly 100 mph. These wind gusts were deemed an error due to lack of corroborating evidence such as damage that would accompany 100 mph winds in a populated area that exists near the Beaumont RAWS. Also, a wind gust value of 100 is a RAWS error code. This error occurs at random times due to a software defect with certain versions of the firmware in RAWS units. The Santa Ana Winds develop due to the cooler air over the Mohave Desert having higher pressure than the warmer air to the west over the greater Los Angeles basin. Fire Weather Figure 1 shows the terrain and surface weather data over southern California at 7:00 a.m. PDT on October 26. This map shows how cold air pooling over the Mohave Desert is blocked by the San Bernardino and San Jacinto Mountains. San Gorgonio Pass is aligned east-west constraining the winds to blow only east or west. At 7:00 a.m., the Santa Ana Winds have driven westward through most, but not all of the greater Los Angeles basin. A few RAWS in the lower left portion of the map still show high relative humidities indicating the dry Santa Ana air has not penetrated into those areas. Also evident on this map are the terrain aligned winds north and northwest of San Bernardino. In these areas, the wind is rushing through the lowest elevation passes from the north into the Los Angeles Basin. Some of the temperature differences in the “cool” air to the east are warmer than locations to the west. This difference is due to the elevation differences in the stations. Areas near Palm Springs (elevation near 500 feet) are lower in elevation than sites southwest of the accident site in the San Jacinto Mountains that are near 2,000 feet. For reference, San Gorgonio Pass has an elevation of 2,600 feet; the accident site is near 3,300 feet; the San Jacinto Mountains rise to over 10,000 feet; and the San Bernardino Mountains rise to over 11,000 feet.
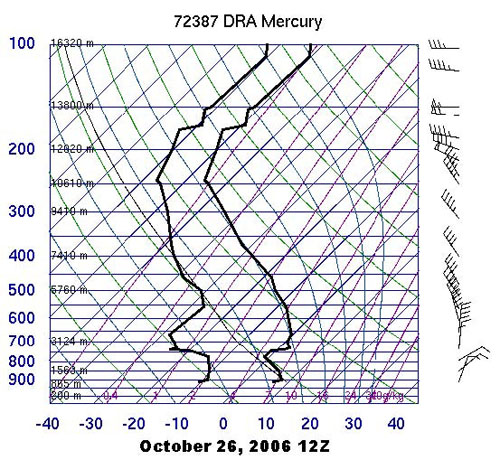
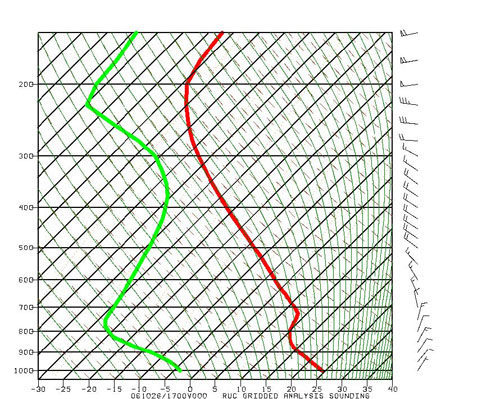
As the cool air pools over the Mohave Desert, a temperature inversion develops as warmer air aloft moves over the area. As the Santa Ana Winds push the cooler air to the west at low levels, the temperature inversion also migrates west into the greater Los Angeles basin. On October 26, this temperature inversion formed near the 6,000 feet Mean Sea Level (MSL). This level was observed on the Mecury, Nevada upper air sounding at 12Z October 26 shown in Fire Weather Figure 2. As the cooler air over the Mohave Desert pushed west into the greater Los Angeles basin the temperature inversion moved west as well. This is shown in the Rapid Update Cycle (RUC) model sounding shown in Fire Weather Figure 3. This sounding shows a model forecast at 17Z October 26, 2006, or 9:00 a.m. PDT, at the grid point closest to the accident site. On the morning of October 26, this inversion was observed in the smoke behavior over the Esperanza Fire and pilots flying over the area confirmed the inversion height was near the 6,000 foot level. The progression of the Santa Ana winds is not uniform through the area. The cooler air over the Mohave Desert spills through lower passes first, then as the depth of the cool air increases, the air spills from the Mohave Desert to the west through progressively higher elevations. Mountain barriers significantly effect the wind direction on a local level, however over the Esperanza Fire location, the dominant wind flow in this situation was from the northeast. The wind deviating only slightly from this direction as the terrain dictates. The northeast wind at elevations below 6,000 feet MSL can be seen in the Mercury sounding shown in Figure 2 and in the model sounding shown in figure 3.
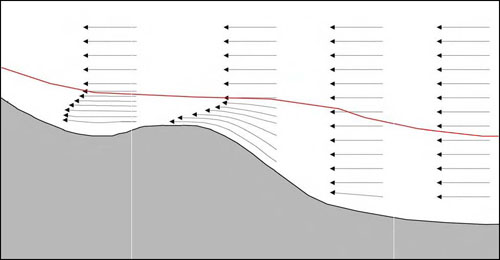
The inversion over the area played a critical role in fire behavior. This includes channeling winds near the ground and preventing full ventilation of the fire under the stable atmospheric conditions present at this point in time as shown by the upper air soundings shown in Fire Weather Figures 2 and 3. The inversion was not at a constant height over the area. Over the San Gorgonio Pass area, the inversion height was between 5,000 and 6,000 feet MSL. The height of this inversion was forecast by the RUC computer model, and the height was confirmed near this level through observations and photos taken of the smoke plume over the fire at approximately 9:00 am by the Air Operations Supervisor. The inversion height slopes upward over higher terrain, but it does not stay at a constant height above the terrain. Fire Weather Figure 4 displays how winds follow the contours of a sloping land surface under inversion conditions described above. The free air above the inversion is minimally affected by the terrain. However under the inversion, wind speeds will increase as the distance between the ground and inversion decrease. The winds will increase the greatest closest to the ground where the slope has the greatest steepness. Shortly before 7:00 a.m. on Thursday, October 26, the fire plume was able to generate enough heat to cause the air and smoke column to begin rising above the inversion layer. The location where the plume broke through the inversion layer was approximately 2 miles southwest of the accident site, in the upper reaches of the “unnamed creek drainage”. Once this plume rose above the inversion layer it acted as a relief valve giving the area better ventilation. Because air was no longer constrained to flow between the ground and the inversion but could also now rise above the inversion in the developing plume, wind speeds on the upwind side of the plume, near the accident site, increased. At approximately 7:00 a.m. on Thursday, October 26 several factors came together to cause a rapid increase in northeast winds in the vicinity of the accident site. The Santa Ana Winds were increasing their influence on the area as evident by the steady increase in sustained and peak wind speeds at Beaumont in the early morning hours (see Fire Weather Table 1). The orientation of the “unnamed creek drainage” next to the accident site is aligned from northeast to southwest, the same direction as the Santa Ana winds in this area as observed by firefighters in the area. Fire had also burned into the upper reaches of the “unnamed creek drainage” (south of Twin Pines Road and southwest of the accident site) where it developed a plume that had penetrated the inversion. This plume, according to the National Weather Service 88D Radar rose to between 18,000 feet and 24,000 feet MSL between 7:00 a.m. and 8:00 a.m. PDT. Feeding this plume required a large quantity of air moving up the valley then rising in the vertical column. When the burnover occurred, the following factors contributed to create extreme fire behavior:
When the above conditions developed at roughly 7:10 a.m., the winds carried the flame front through the accident site very rapidly. The topographic shape of the accident site channeled the winds and flame directly at Engine 57. Burn patterns in the trees near Engine 57 indicate the flame height remained within 15 feet of the ground. This is consistent with the wind remaining parallel with the ground and increasing in speed near the ground as the wind climbed the slope immediately northeast of Engine 57, overran Engine 57, then ran southwest around the Octagon House. The nearly round shape of the house influenced the flow pattern of the wind and flame around the house. Because the house had a nearly round shape, the wind carried the flame around both sides of the house, wrapping around the house on the downwind side, with the flame front from each side meeting on the downwind side. This effectively makes for no safe place to escape the flames near this house. The exact wind speed when the fire front moved through the accident site is unknown. Interviews with firefighters that were located at the Doublewide immediately southwest of the accident site indicate wind speeds at eye level were approximately 40 mph during and shortly after the fire front moved through their location. It is not unrealistic to expect that wind gusts at the Doublewide were near 50 mph. At the accident site, wind speeds are greatly influenced by the terrain. For northeast winds that were present on the morning of the accident, the steep slope immediately upwind (northeast) of the accident site causes a strong acceleration in wind speed as the wind climbs the slope. With the reported conditions by firefighters at the relatively protected Doublewide site, it is not unrealistic to expect winds near Engine 57 to have been 50 to 70 mph as the fire front moved through the area. Fifteen to 30 minutes after the fire front had gone through the Doublewide area, firefighters who walked from the Doublewide to the accident site reported very strong winds with blowing dust and sand as they approached the accident site. When Engine 57 first arrived at the Octagon House, the view to the northeast down the “unnamed draining” was un-obscured by the smoke. Reports indicate the valley floor near Cabazon was visible and the fire front was well to the east. The fire was casting enough light into the “unnamed creek drainage” such that the shape of the drainage was visible. In the early morning hours, prior to 7:00 a.m. PDT the fire progressed westward into the “unnamed creek drainage” below and northeast of the accident site. As fire got into the “unnamed creek drainage”, the northeast winds carried the smoke southwest over the accident site. At first the smoke density would have been light becoming thicker as the fire front approached. At the Doublewide, smoke densities became so thick that it caused some firefighters to lay on the ground to find cleaner air. All firefighters at the Doublewide sought refuge in their engines for protection from smoke and blowing embers. Conditions at the accident site were likely similar or worse due to the high fuel load on the steep slope immediately upwind of the accident site.
Fire Weather Table 1 - Beaumont RAWS weather from 10:10 am PDT October 25 through 6:10 pm PDT October 26. Weather Dissemination Standard Operating Procedures National Weather Service (NWS)
RFW – Red Flag Warning and Fire Weather Watch - Issued as needed according to the criteria below. Criteria for the area which covers the Esperanza Fire are as follows:
CAL FIRE Riverside Unit (RRU) San Bernardino National Forest (BDF) Findings and Facts gleaned from interviews and documents
< < < continue reading—Esperanza Fire Factual Report, appendix 7—human factors analysis > > >
|
|||||||
| © 2005-2021 Colorado Firecamp, Inc. | home • schedule • blog • ENGB • facility • about us• FAQ's |