Rocky Mountain Area Predictive
Services
2006 Preliminary Seasonal Fire Weather / Fire Danger
Outlook
April 13, 2006
C. 2006 Weather Outlooks For Spring and Summer
The precipitation and temperature outlooks from the Climate Prediction
Center for Spring 2006 (Figures 18
and 19) show a tilt towards drier than
average conditions April, May, June across Kansas, southern Nebraska and
the eastern two-thirds of Colorado. Warmer than average conditions are
forecast across southern sections of the RMA this Spring. For June, July
and August 2006, below average precipitation is forecast for portions
of eastern Colorado and western Kansas, with warmer than average temperatures
forecast for much of the RMA (Figure 20
and 21).
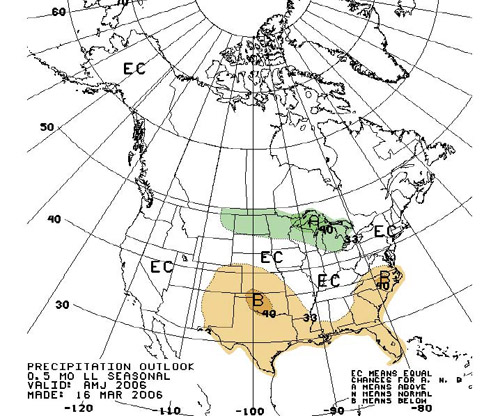
Figure 18. CPC 2006 Spring (April, May, June) Precipitation Outlook.

Figure 19. CPC 2006 Spring (April, May, June) Temperature Outlook.
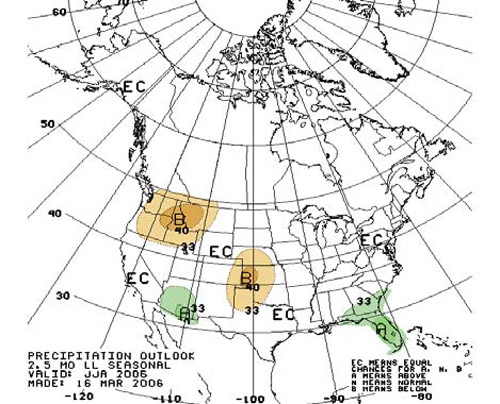
Figure 20. CPC 2006 Summer (June, July, August) Precipitation Outlook.
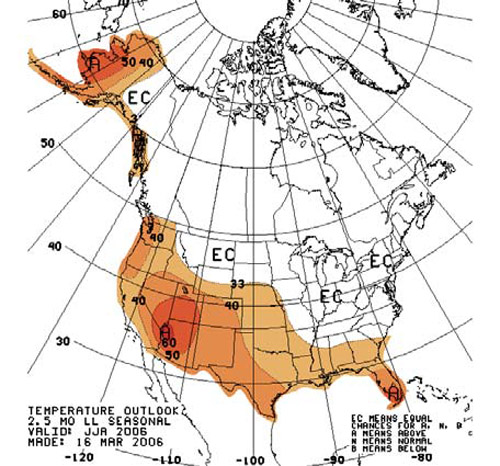
Figure 21. CPC 2006 Summer (June, July, August) Temperature Outlook.
Persistent weak La Nina conditions and its impact on the 2006 RMA spring
and summer temperature and precipitation patterns is unknown. ENSO outlooks
suggest weakening of La Nina conditions through the end of 2006. Historical
impacts on spring and summer temperature and precipitation in the RMA
during past La Nina episodes do raise some concerns on possible dry and
hot scenarios for portions of the RMA for the upcoming fire season. Figure
22 shows temperature (on the [top]) and precipitation (on
the [bottom]) anomalies using 11 La Nina cases during the spring months
of April, May, June. Above average temperature anomalies (positive) are
noted over portions of Kansas and eastern Colorado, otherwise average
to below average temperature anomalies have occurred across the remainder
of the RMA. Below average (negative) precipitation anomalies show dryness
over much of the RMA.
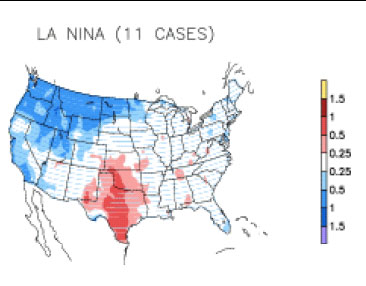
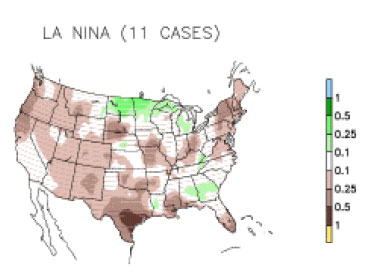
Figure 22. Spring (April, May, June) temperature (on the [top]) and precipitation
(on the [bottom]) anomalies using 11 La Nina cases. For temperature on
the [top], blue colors indicated below average temperature and red colors
indicate above average temperatures. For precipitation on the [bottom],
brown colors indicate below average precipitation, and green indicates
above average precipitation.
Figure 23 shows summer temperature
(on the [top]) and precipitation (on the [bottom]) anomalies during 12
La Nina cases. Average to above average temperatures often occur across
the RMA when La Nina conditions persist in the summer months. Also, below
average precipitation often occurs across much of the RMA.
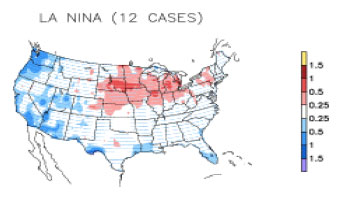
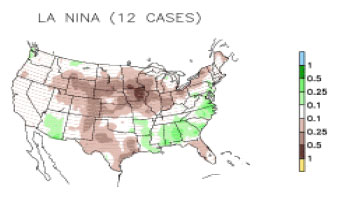
Figure 23. Summer (June, July, August) temperature (on the [top]) and
precipitation (on the [bottom]) anomalies using 12 La Nina cases. For
temperature on the [top], blue colors indicated below average temperature
and red colors indicate above average temperatures. For precipitation
on the [bottom], brown colors indicate below average precipitation, and
green indicates above average precipitation.
Another climate predictor that may have impacts on spring and summer
temperature and precipitation patterns in the RMA in 2006 includes the
North Atlantic Oscillation (NAO). The NAO is defined by the difference
between high pressure from the eastern sea board into south-central Europe
versus low pressure over Iceland. NAO has been mostly negative over the
winter. A negative NAO could also impact North American climate this spring
and summer. Past negative NAO episodes have resulted in warmer than average
temperatures, below average precipitation, and drier than average relative
humidity during the spring and summer months across much of the Rockies
(Refer to spring and summer precipitation and relative humidity anomalies
figures 24-27).
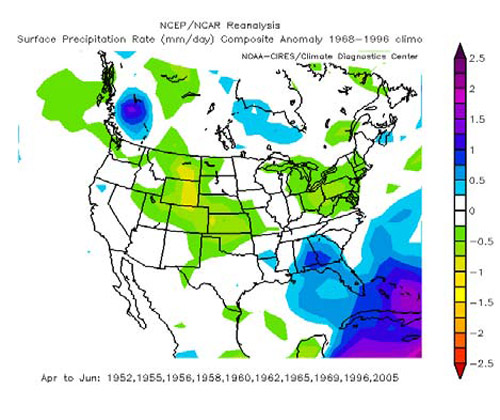
Figure 24 Surface precipitation
rate composite anomaly during negative NAO for April thru June.
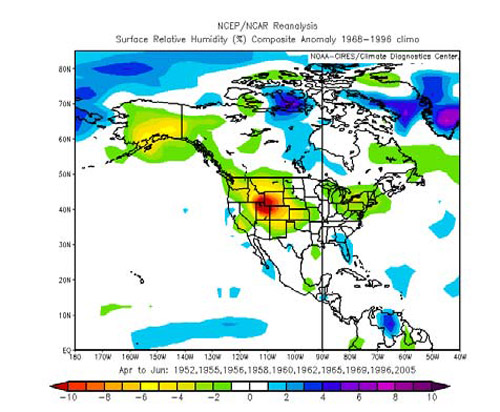
Figure 25 Surface relative humidity composite anomaly during negative
NAO for April thru June.
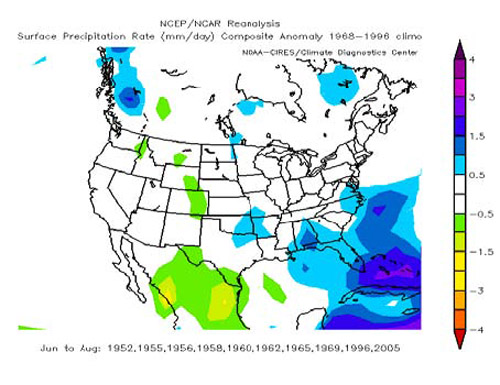
Figure 26 Surface precipitation rate composite anomaly during negative
NAO for June through August.
Figure 27 Surface relative humidity composite anomaly during negative
NAO for June thru August.
<<< continue
reading — 2006 Seasonal Outlook, Fuels Analysis >>>
|